Generate a matchit object a a point along the frontier
frontier_to_matchit.RdgenerateDataset() generates a matchit object at a given point along the frontier identified either by the number of units remaining or the number of units dropped at that point on the frontier. All MatchIt functions that work with matchit objects can be used on the output, such as summary.matchit() for checking balance.
frontier_to_matchit(frontier.object, N, Ndrop)Arguments
- frontier.object
a
matchFrontierobject; the output of a call tomakeFrontier().- N
the number of units remaining in the sample at the desired point on the frontier. Exactly one of
NorNdropmust be specified.- Ndrop
the number of units dropped in the sample at the desired point on the frontier. Exactly one of
NorNdropmust be specified.
Details
The argument to N or Ndrop depend on the quantity of interest (QOI) supplied to the original call to makeFrontier(). When QOI was "SATE" or "FSATE", they correspond to the total number of units remaining or dropped. When QOI was "SATT", they correspond to the number of control units remaining or dropped (since no treated units are dropped). When QOI was "FSATT", they correspond to the number of treated units remaining or dropped. See also the n component of the matchFrontier object at makeFrontier(). When using summary.matchFrontier(), the carrot printed underneath the summary table indicates which group N and Ndrop refer to.
Value
A matchit object. See matchit() for further details. The following components are included in the output:
- match.matrix
a matrix containing information on which units are matched to which. Only present when using a pair distance=based frontier.
- weights
the resulting matching weights. Dropped units will have a weight of 0.
- X
a data frame of the covariates used in matching.
- call
the
makeFrontier()call.- info
information on the matching method and distance measures used, to be processed by
print.matchit().- estimand
the target estimand. Will be
"ATE"whenQOIis"SATE"or"FSATE", and will be"ATT"whenQOIis"SATT"or"FSATT".- formula
a formula relating the treatment to the matching covariates.
- treat
a vector of treatment status converted to zeros (0) and ones (1) if not already in that format.
- nn
a matrix of the sample sizes of the treated and control groups before and after matching.
See also
Examples
data("lalonde", package = "MatchIt")

#Pair distance frontier for FSATT
f1 <- makeFrontier(treat ~ age + educ + married + re74,
                   data = lalonde, QOI = "FSATT",
                   metric = "dist", verbose = FALSE)
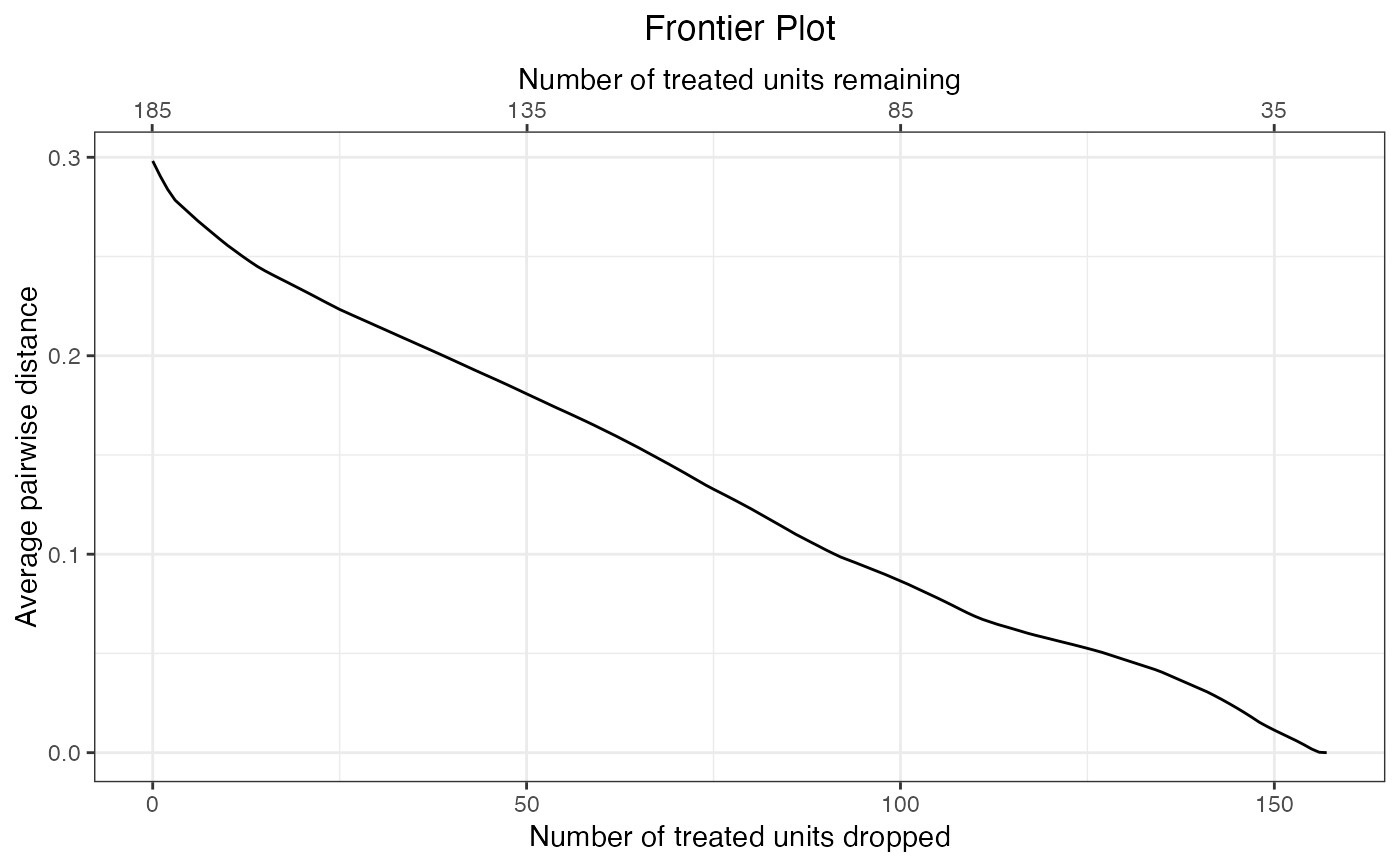
plot(f1)


#Convert to matchit object after dropping 120 treated units
m1 <- frontier_to_matchit(f1, Ndrop = 120)

#Usual MatchIt functions work
m1
#> A matchit object
#>  - method: 1:1 matching frontier (minimizing the average pairwise distance)
#>  - number of obs.: 614 (original), 99 (matched)
#>  - target estimand: ATT
#>  - covariates: age, educ, married, re74
summary(m1)
#>
#> Call:
#> makeFrontier(formula = treat ~ age + educ + married + re74, data = lalonde,
#>     QOI = "FSATT", metric = "dist", verbose = FALSE)
#>
#> Summary of Balance for All Data:
#>         Means Treated Means Control Std. Mean Diff. Var. Ratio eCDF Mean
#> age           25.8162       28.0303         -0.3094     0.4400    0.0813
#> educ          10.3459       10.2354          0.0550     0.4959    0.0347
#> married        0.1892        0.5128         -0.8263          .    0.3236
#> re74        2095.5737     5619.2365         -0.7211     0.5181    0.2248
#>         eCDF Max
#> age       0.1577
#> educ      0.1114
#> married   0.3236
#> re74      0.4470
#>
#>
#> Summary of Balance for Matched Data:
#>         Means Treated Means Control Std. Mean Diff. Var. Ratio eCDF Mean
#> age           21.5846       21.4615          0.0172     0.9488    0.0092
#> educ          10.4308       10.4308          0.0000     0.9683    0.0000
#> married        0.1231        0.1231          0.0000          .    0.0000
#> re74         256.9393      265.0737         -0.0017     0.9027    0.0071
#>         eCDF Max Std. Pair Dist.
#> age       0.0769          0.0602
#> educ      0.0000          0.0000
#> married   0.0000          0.0000
#> re74      0.0923          0.0135
#>
#> Sample Sizes:
#>               Control Treated
#> All            429.       185
#> Matched (ESS)   21.45      65
#> Matched         34.        65
#> Unmatched      395.       120
#> Discarded        0.         0
#>